Most returns are not a logistics failure. They are an expectation failure, and the expectation was set on your product page.
A customer looked at six photos, read a spec sheet, guessed at the rest, and guessed wrong. The item shipped, arrived, and went straight back. Nothing broke. Nothing was late. The page just promised something the box did not deliver.
If you want to reduce product returns in ecommerce, that gap is the only part of the problem you can fix without touching your warehouse, your carrier contracts, or your policy page.
Key Takeaways
- Product returns are a margin problem before they are a logistics problem. Each one eats shipping both ways, inspection labor, and often the full resale value.
- Most returns trace back to a mismatch between what the shopper expected and what arrived. That is a content failure, not an operations failure.
- Photography stops working when the decision depends on scale, fit, motion, material, or compatibility. Those are the categories with the worst return rates.
- 3D product visuals let a shopper rotate, scale, and inspect an item before buying, which removes the guesswork behind most avoidable returns.
- Not every return is preventable. Bracketing and buyer’s remorse will not respond to better visuals, and budgeting as if they will is wasted money.
- Sort returns by reason code before rebuilding anything. The SKUs that look worst rarely hold the most recoverable revenue.
Product Returns Are a Margin Problem, Not a Shipping Problem
Here is the framing that gets executive attention. A return does not cost you a shipping label. It costs you the sale.
Work through one returned pair of boots. You paid to ship it out and paid to ship it back. Someone opened the box, inspected the item, decided whether it could be restocked, and processed the refund. If the packaging is scuffed or the boots were worn once, it goes to liquidation at a fraction of retail. The marketing spend that won that customer is already gone.
Retail industry research puts returns in the trillions of dollars annually, with online rates running roughly double what physical stores see. On thin ecommerce margins, sitting a few points above your category average is the difference between a profitable quarter and a flat one.
Which is why the question of how to reduce ecommerce returns usually gets asked in the wrong department. Logistics optimizes the reverse flow. Finance models the cost. Nobody goes back and asks why the shopper misjudged the product in the first place.
Why Do Customers Return Products Online?
Customers return products online because they could not evaluate the item properly before buying. Everything else is a symptom.
Sort through the causes of ecommerce returns and most land in a handful of buckets:
It didn’t fit. Dominant in apparel and footwear, and rising in furniture. Size charts are static, brands size inconsistently, and a flat photo says nothing about how a garment sits on a body that isn’t the model’s.
It didn’t look like the photos. Color shifted under different lighting. A finish read matte online and arrived glossy. The material looked substantial and turned out flimsy.
It was wrong for the space. Furniture, appliances, anything that has to fit somewhere specific. Dimensions were listed. The shopper simply could not picture them.
It wasn’t compatible. Car accessories, replacement parts, tech peripherals. The part does not fit their vehicle or device.
They ordered several on purpose. Bracketing. Two sizes, three colors, keep one, return the rest.
They changed their mind. Sometimes that is genuinely it.
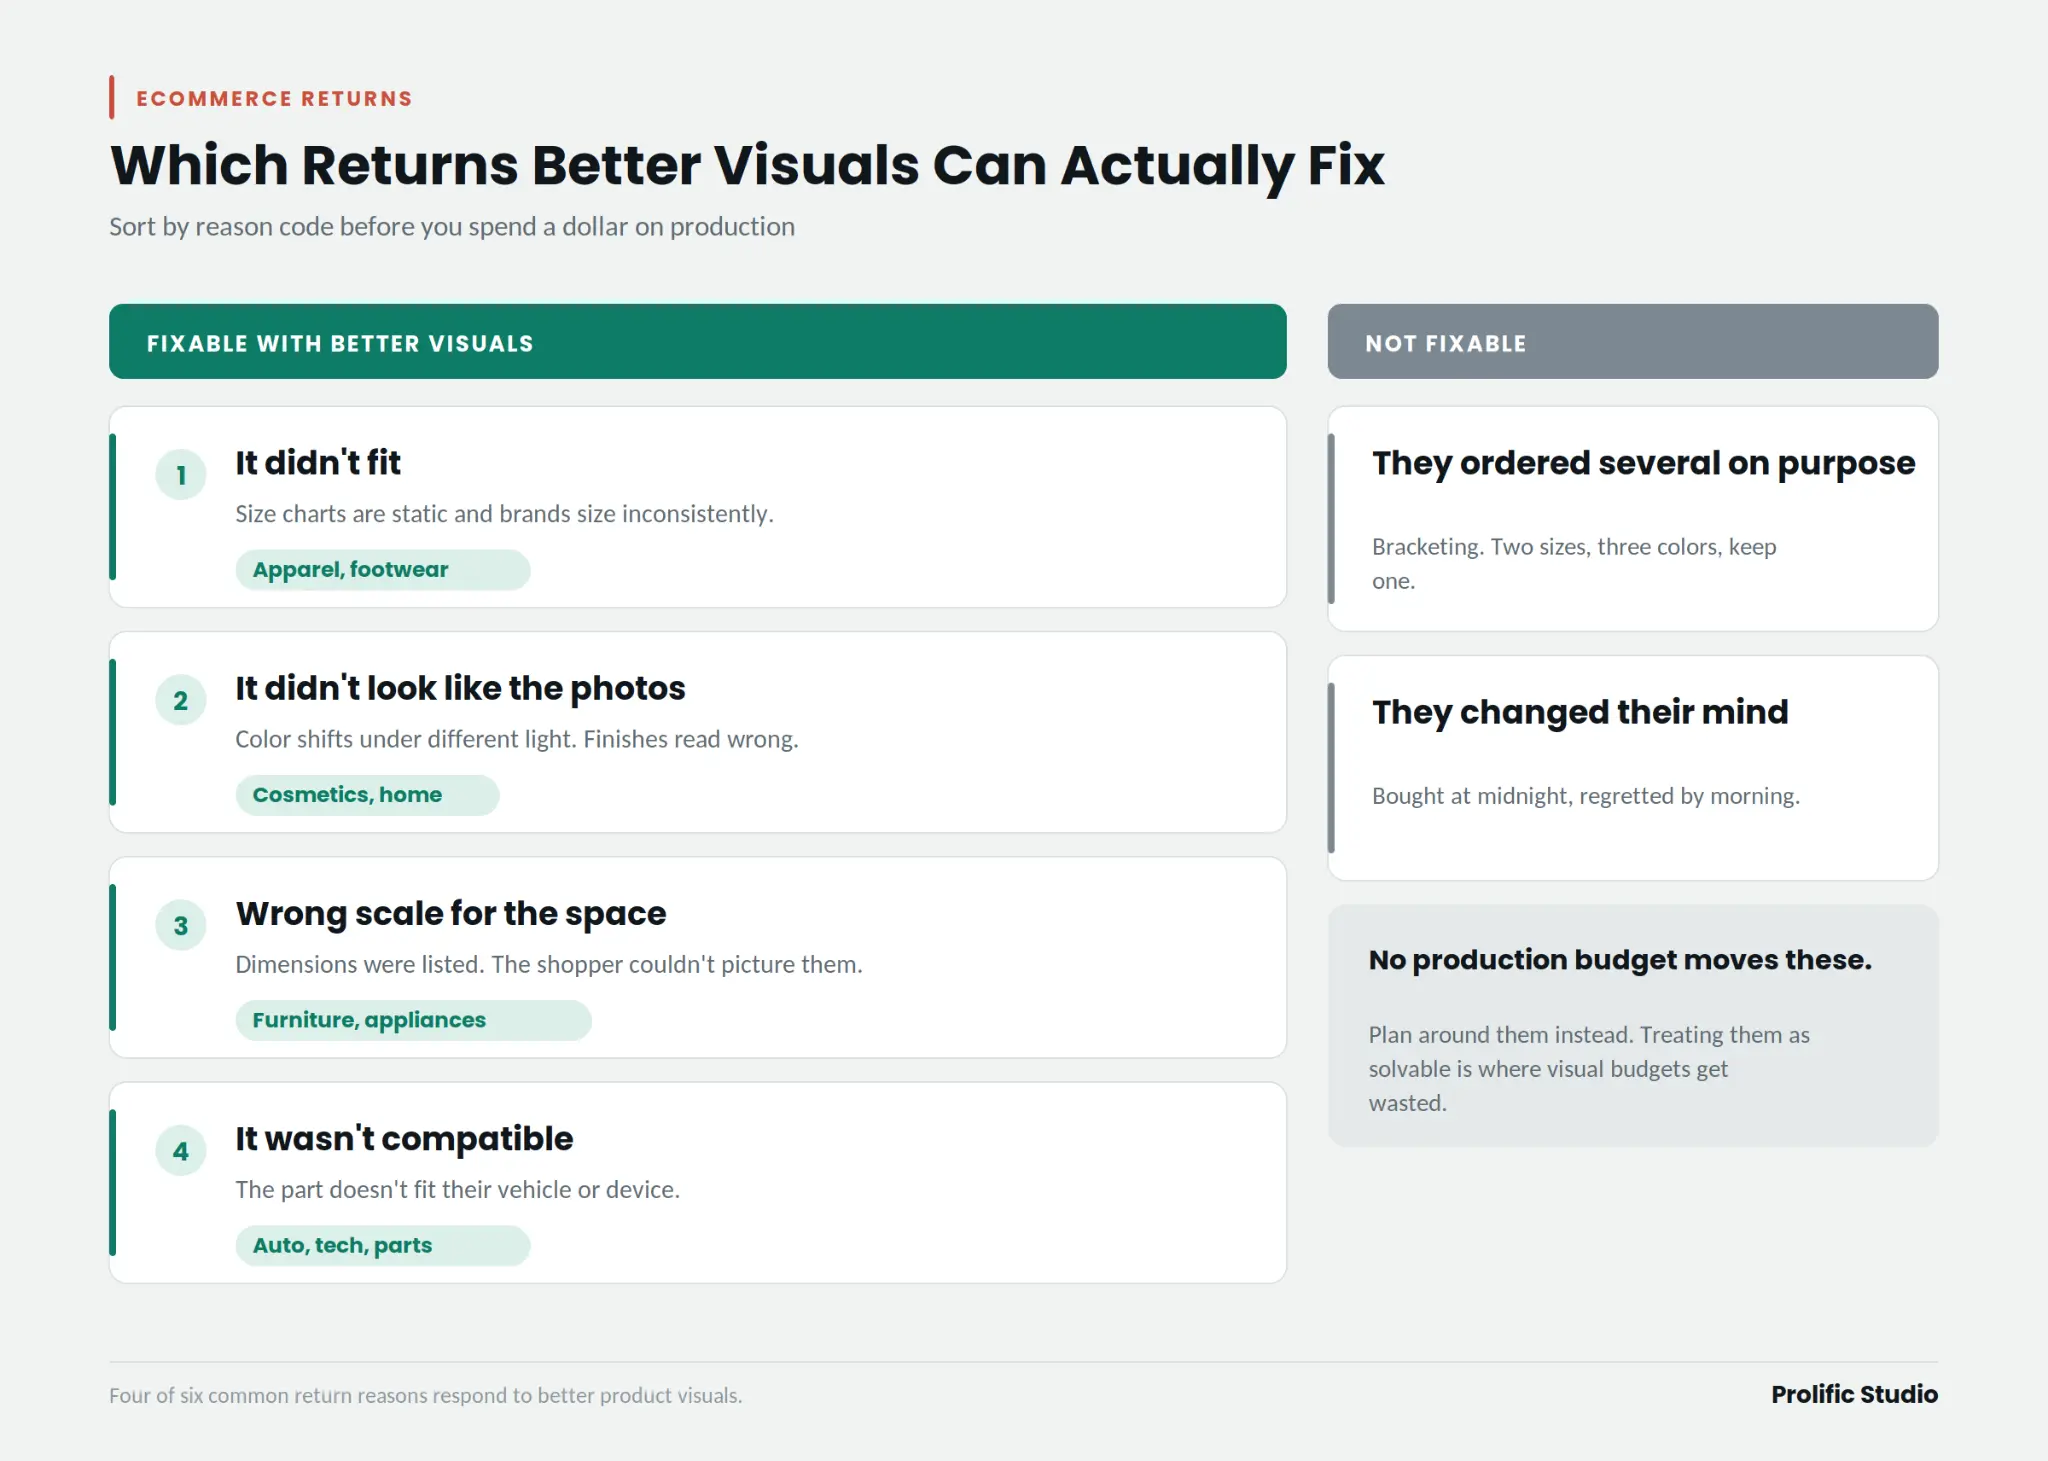
The first four are content failures. You caused them, so you can fix them. The last two are behavioral, and no production budget moves them much. That line matters more than most teams admit, because it decides what a visual investment can realistically return.
Do Better Product Images Reduce Returns?
Yes, but only for returns that stem from misjudgment.
The link between product returns and product images gets clear the moment you sort by reason code. If someone sent back a jacket because the sleeves ran short, imagery could have shown them that. If they sent it back because they ordered three intending to keep one, no image was ever going to help.
UX research on ecommerce product pages keeps finding that shoppers want views most sites never provide: angles the catalog skipped, close detail on texture and stitching, and some sense of scale against something familiar. When those are missing, people either abandon the cart or buy on a guess. Guessed purchases come back.
So you can decrease returns with better visuals in categories where uncertainty drives the decision. Apparel, footwear, furniture, cosmetics, anything with fitment requirements. Where the product is simple and well understood, a book or a bag of coffee, better imagery lifts conversion but barely touches returns.
Know which one you are selling before commissioning anything.
Where Flat Product Photography Runs Out of Road
Photography is excellent at one job: showing what something looks like from a fixed position under controlled light. That covers plenty of retail.
It breaks down when the decision depends on something a still frame cannot carry.
Scale. A photo of a side table shows its proportions. It says nothing about whether it clears your sofa arm.
Motion and mechanism. How a stroller folds. Whether a suitcase handle telescopes smoothly or wobbles.
Material behavior. How fabric drapes when someone sits. How a finish catches light as you move past it.
Hidden structure. What is inside the pack. How a mattress is layered. Where the reinforcement sits in a hiking boot.
Fitment. Whether this roof rack works with your specific trim year.
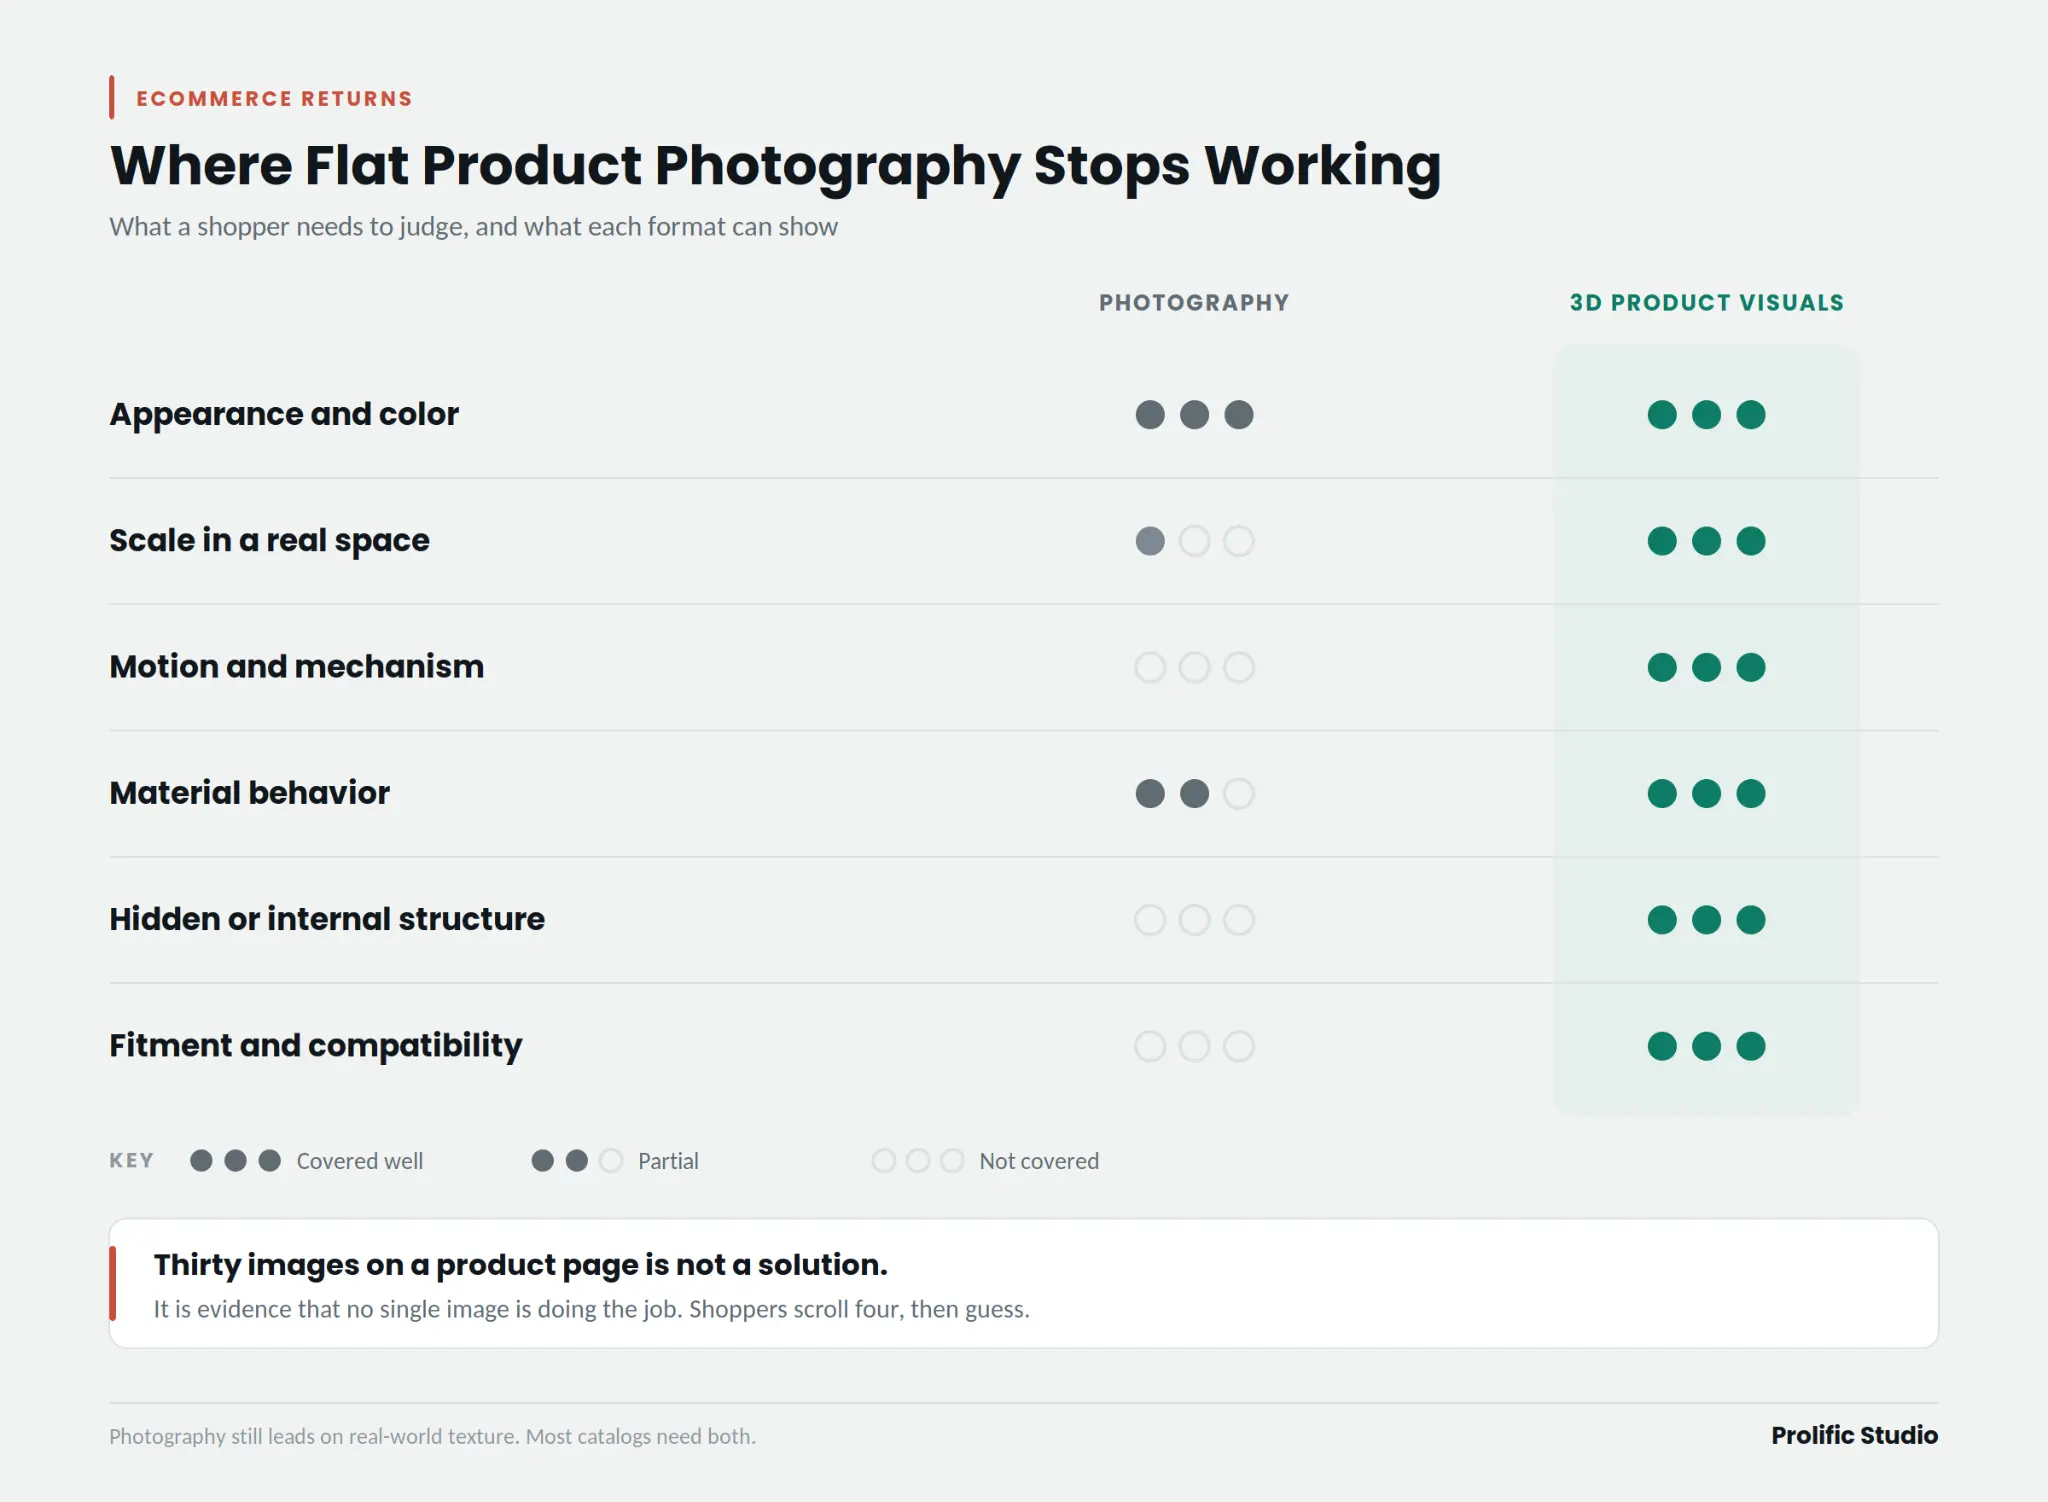
Some brands try to solve this with volume. Thirty images on a product page is not a solution, though. It is evidence that no single image is doing its job, and nobody scrolls thirty images. They scroll four and guess.
What 3D Product Visuals Show That a Photograph Cannot
This is where 3D product animation services change the economics of a product page rather than just its looks.
A 3D asset gets built once from real product geometry, then reused indefinitely. From one build, you get a 360-degree spin the shopper controls, exploded views showing internal construction, animated sequences demonstrating how something works, scale comparisons against a known reference, and every colorway rendered without reshooting anything.
That last point tends to surprise finance teams. Sell a chair in eleven fabrics and photography means eleven shoots. 3D product visualization means one build and eleven material swaps. The cost curve inverts the moment your catalog has variants.
More importantly, the shopper gets to interrogate the product. They rotate it, look underneath, watch the mechanism open. Questions they would have guessed at get answered on the page instead of in their living room three days later.
Not every product justifies it. A 3D build costs more up front than a photo shoot, and for a simple, single-variant, low-return item the math does not work. Our comparison of 2D vs 3D product animation covers where each earns its budget.
Four Verticals With Four Completely Different Return Problems
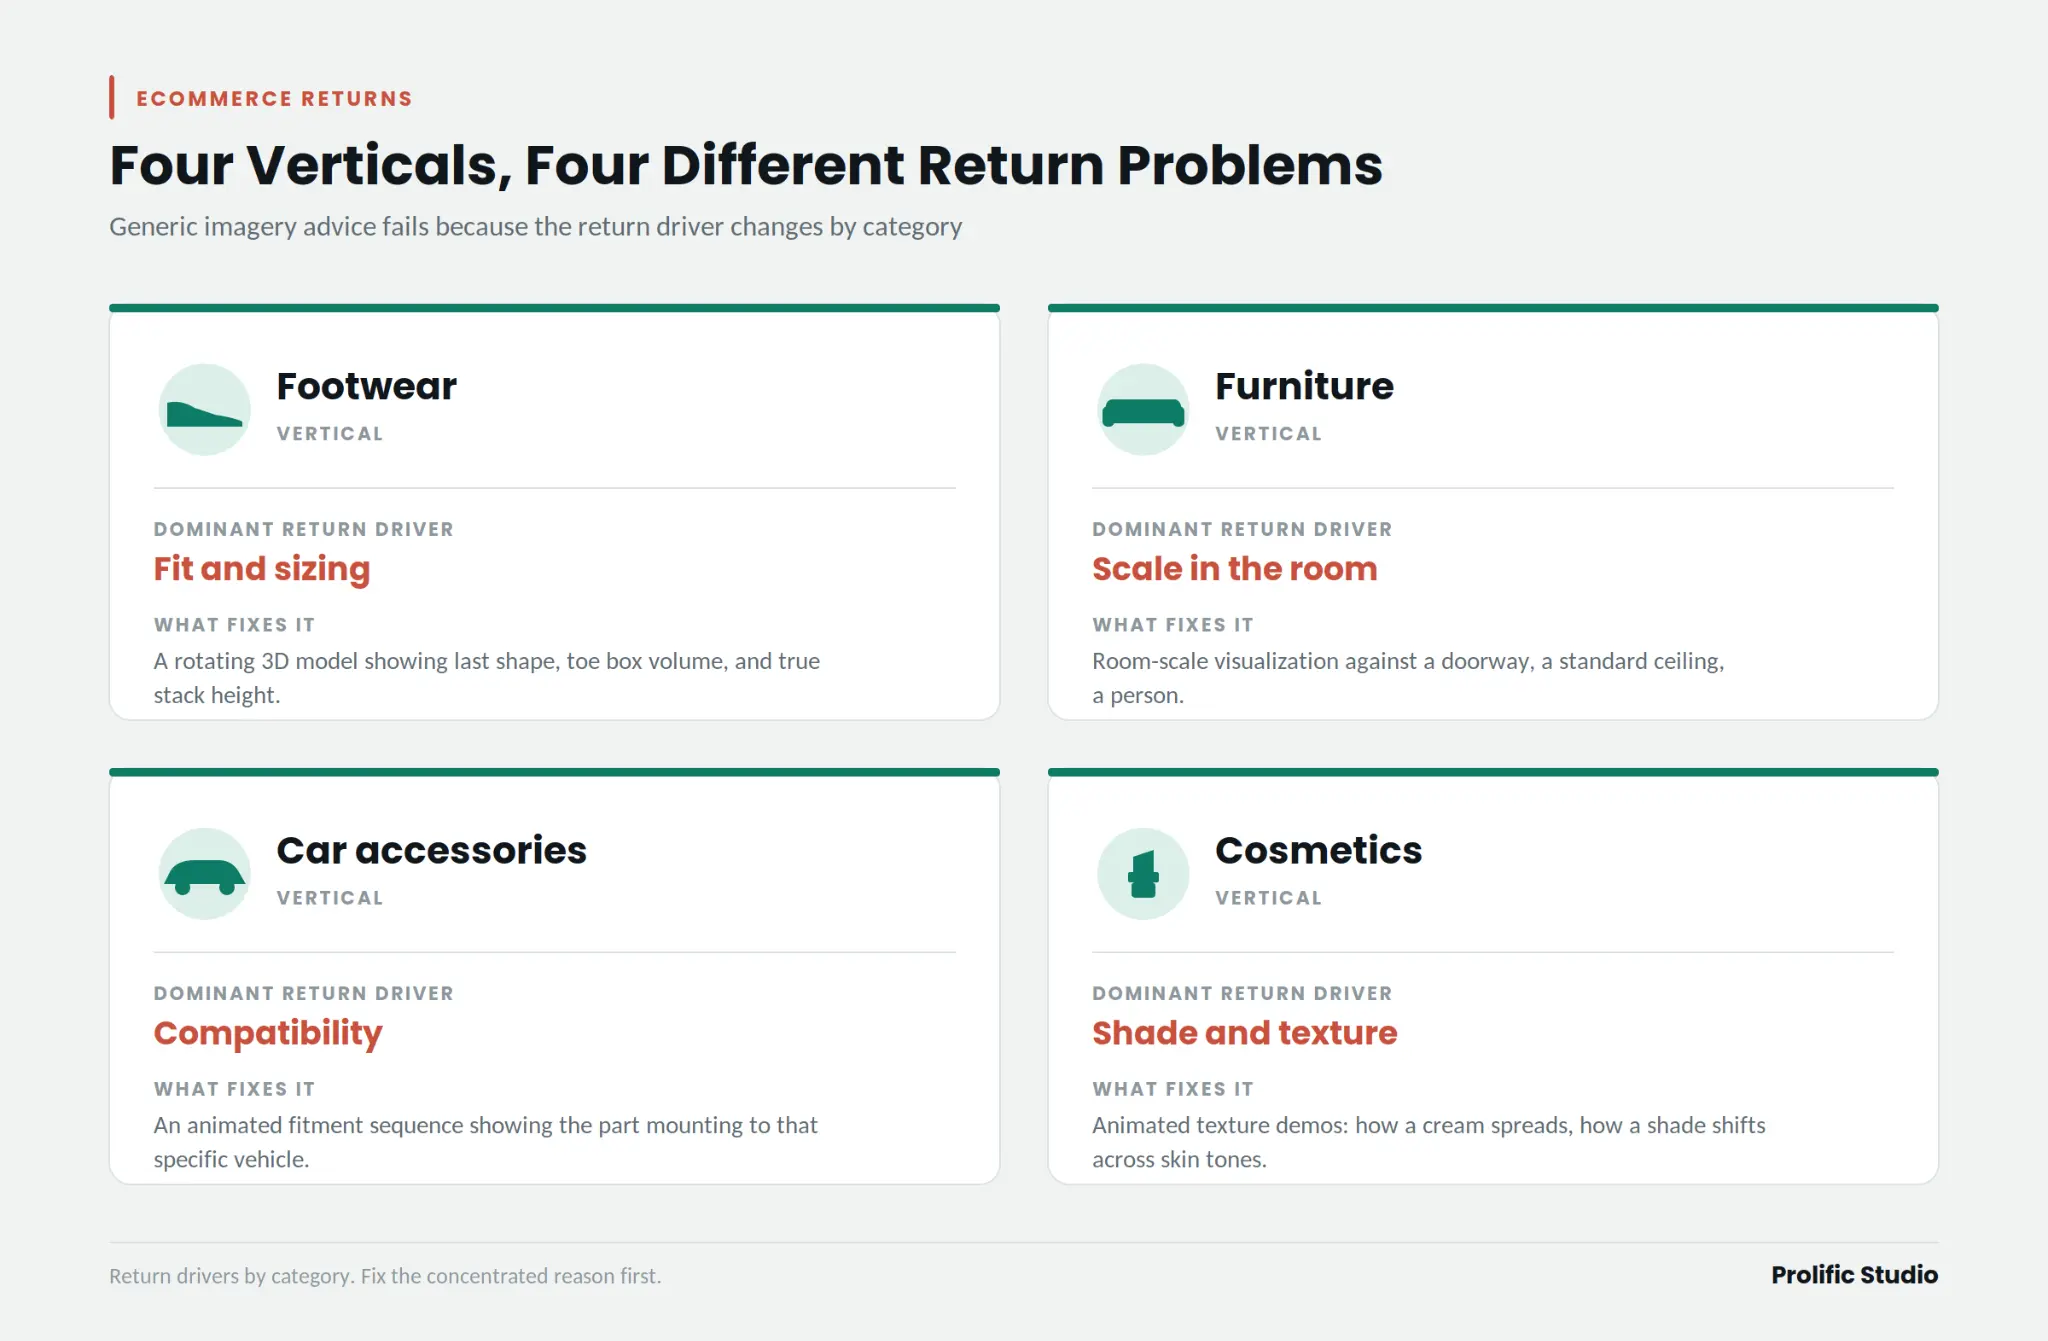
Generic advice about imagery fails because the return driver changes by category. Here is what actually moves the number in four of the worst-hit verticals.
Footwear: The Fit Problem Nobody Has Solved
Footwear carries some of the highest return rates in retail. Fit and sizing consistently rank as the leading return reason in apparel, and sizing runs inconsistently across brands; width is rarely communicated, and someone who wears a 10 in one label wears a 10.5 in another.
Anyone working out how to reduce returns in online fashion should start with what a photo hides: the profile from the inside, toe box volume, actual stack height. A rotating 3D model showing the last shape and a cross-section of the footbed answers what a lifestyle shot never will.
Furniture: Everything Hinges on Scale
Furniture returns hurt because reverse logistics on a sofa can wipe out the margin on three more.
The failure is almost always spatial. Dimensions sit right there on the page and the shopper still cannot picture them. What works is showing the piece against a reference: a doorway, a standard ceiling, a person. Room-scale visualization lets someone confirm it fits before a truck gets involved.
Car Accessories: Compatibility, Not Aesthetics
Nobody returns a roof rack because it looked different online. They return it because it does not fit their car.
This is a data problem wearing a visual costume, and the fix is a hybrid. An animated fitment sequence showing the part mounting to a specific vehicle, paired with clear compatibility logic, removes the ambiguity. A 2D animation studio can produce the explanatory layer, installation order, and torque points for a fraction of full 3D.
Cosmetics: Color, Texture, and Trust
Beauty returns cluster around shade mismatch and texture surprise. A lipstick shot under studio light is a different color than the one that arrives.
Static swatches are the weakest element on most beauty pages. Animated texture demonstrations, showing how a cream spreads, how a powder builds, how a shade shifts across skin tones, close the gap a flat swatch square opens.
Measure Return Reasons Before You Rebuild Any Product Page
Teams asking how to lower return rate in ecommerce almost always begin by rebuilding their bestsellers. That is backwards.
Start with reason-code data at SKU level. Pull ninety days and sort by reason. You are hunting for concentration: SKUs where one specific reason drives most returns. That is solvable. A SKU with returns spread evenly across every code usually just means people do not love the product.
Then rank by recoverable revenue rather than return rate. A 40% return rate on a $30 item selling twice a week is noise. An 18% rate on a $900 item selling forty times a week is where the money sits.
Three numbers before you spend anything: return rate by category, the reason-code breakdown for your top twenty revenue SKUs, and your fully loaded cost per return including labor and lost resale value. Without that third figure you cannot build a budget case, and any effort to reduce return rate for an online store stays guesswork.
What Prolific Studio Builds for Ecommerce Teams
We work with brands whose products are complex enough that the page has to do real explaining.
Usually that means one of three things. A 3D asset library built from your product geometry, so every future variant, campaign, and marketplace listing pulls from one source. Animated demonstration sequences for products that only make sense in motion. Or a modular system where a single build generates the spin, the hero image, the paid social cut, and the marketplace asset without a reshoot.
As a 3D animation company, the work we spend most time on is not rendering. It is deciding which twelve SKUs out of four hundred justify the investment. That conversation is often worth more to a client than the assets.
Comparing options for animation services? Our guide to animation studios in Los Angeles covers what to look for.
Final Words
Returns are the bill for a promise your product page could not keep.
Part of that bill is unavoidable. People bracket sizes, change their minds, and buy things at midnight they do not want by morning. Chasing those with production budget is waste.
The returns that come from real misjudgment are different. Wrong fit, wrong scale, wrong finish, a part that will not bolt on. Those came from a page that asked the shopper to imagine something instead of showing it, and those are yours to fix.
Sort your returns by reason. Find where the uncertainty concentrates. Rebuild those pages first, then measure across a full season rather than a fortnight.
Working out where visuals fit? Talk to Prolific Studio, a reputable animation production agency, about which of your SKUs would earn back a 3D build.
Frequently Asked Questions
How can I reduce my return rate?
Find out why people are returning things first, because the fix depends entirely on the reason. Pull ninety days of reason-code data at SKU level and look for concentration. If most returns on a product cite fit or “not as described,” that is a page problem, and better visuals will move it. If they cite a change of mind, adjust merchandising or pricing instead. Same symptom, completely different treatment.
Do product videos reduce returns?
In the right categories, yes. Video earns its keep when a product does something: folds, opens, adjusts, moves. Watching a stroller collapse in six seconds answers a question no photo can. For static products, an interactive 360 spin usually beats video, since the shopper controls what they inspect rather than watching what you chose to show. Whether product video can reduce returns really comes down to whether motion is part of the value.
What causes high return rates in ecommerce?
Fit and sizing lead in apparel and footwear. Scale misjudgment dominates furniture. Compatibility drives automotive and parts. Shade and texture mismatch account for most beauty returns. Underneath all four sits one cause: the shopper could not properly evaluate the item, so they bought on a guess. Bracketing and buyer’s remorse make up the remainder, and those are behavioral rather than informational.
What is a good ecommerce return rate?
Benchmark against your vertical rather than a general figure. Electronics and home goods usually sit in the high single digits. Apparel and footwear run far higher, sometimes into the twenties or thirties. The more useful question is not whether your rate looks good in the abstract. It is whether the rate is drifting upward, and whether the reasons behind it are ones you could actually address.
Why do people return more when shopping online than in stores?
Because in a store they handle the product first. They check the weight, try the size, see the true color, and decide before paying. Online, that evaluation happens after the money moves and the box lands. The return is just the in-store try-on relocated to the customer’s living room at your expense. Every piece of information you shift to before the purchase reduces how often it happens.
Related Articles
- What are the Various Types and Techniques of 3D Animations?
- 3D Animation Storyboard: Here’s Everything You Need to Know
- Top 10 Animation Styles for Your Business